Eskay Expands High-Grade Vein-Hosted Gold-Silver Mineralization at its 100% Controlled and Consolidated Eskay Project in the Golden Triangle
TORONTO, ON / ACCESS Newswire / September 17, 2025 / Eskay Mining Corp. ("Eskay" or the "Company") (TSXV:ESK)(OTC PINK:ESKYF)(Frankfurt:KN7)(WKN: A0YDPM) is pleased to provide initial assay results from its prospecting and sampling program at its 100%-controlled Consolidated Eskay Project in the Golden Triangle, British Columbia. The Company's geological team, through systematic prospecting and sampling, has significantly expanded the area where high-grade gold veins were discovered in 2024. Samples from areas including Vermillion, TM, Red Lightning, and Big Red, zones surrounding Unuk Finger Mountain in the southern extent of the Property, have all yielded numerous high-grade assays.
2025 Select Highlights
10 rock samples assayed over 20 g/t Au, 20 samples assayed over 10 g/t Au, 37 samples assayed over 5 g/t Au, and 68 samples assayed over 1 g/t Au out of a total of 298 surface rock samples
Select individual high-grade spot rock chip results include:
246 g/t Au, 22.8 g/t Ag, and 0.25% Cu
150 g/t Au, 76 g/t Ag, and 1.57% Cu
86.2 g/t Au, 180 g/t Ag, and 2.63% Cu
71.4 g/t Au, 15.8 g/t Ag, and 0.66% Cu
33.7 g/t Au, 257 g/t Ag, and 2.7% Cu
28.8 g/t Au, 363 g/t Ag, and 0.49% Cu
Also noteworthy, a 21.8 g/t Au, 19.9 g/t Ag, and 0.69% Cu channel sample over 1.00m was cut at Vermillion
"Eskay's geological team did a superb job following up on last year's exciting discovery of high-grade gold-silver veins in the southern reaches of our 100%-controlled Consolidated Eskay Project this season," commented Quinton Hennigh, Director and Technical Advisor to Eskay Mining. "With these initial assays, we can now see that there is a wide distribution of veins, some displaying very high grades of gold and silver, across an area at least 2 km wide. This system is demonstrating it has capacity to make high-grade over a large expanse, and our BLEG stream sediment data indicates we have lots more room to grow. I think, given the large magnitude of the BLEG results here coupled with these very strong surface results, we are defining a new high-grade gold-silver vein system akin to those seen at Goliath Resources and Juggernaut Resources, also in the GT."
2025 Exploration Program
The 2025 exploration program at the Eskay Project includes extensive surficial sampling, reconnaissance geological mapping, and channel sampling across target areas around the Unuk Finger Mountain with the goal of advancing early-stage prospects into drill ready targets. A total of 298 rock sample and 29 channel sample assays have been received to date with further sampling ongoing on the Vermillion, TM and Big Red zones. In addition, a Worldview 3 high-resolution satellite imagery survey has been collected across the property with results expected later this month. Hyperspectral imaging and detailed orthophotos will help support focused exploration efforts across Eskay's 200 km2 project area.
Target areas around Unuk Finger mountain in the southeast portion of the Eskay claim block were first explored in the late 1980's but the area has seen limited exploration activities in recent years. Between 2020 and 2022, a bulk leach extractable gold (BLEG) stream sediment sampling program was conducted across large portions of the Eskay Project which identified numerous anomalous gold zones with particularly strong anomalies occurring in watersheds around the Unuk Finger mountain (Figure 1). Initial follow-up work in 2024 around BLEG anomalies successfully identified vein-hosted gold and silver mineralization at the Vermillion and TM zones and follow-up in these areas has been the primary focus of exploration efforts in 2025. Exploration conducted across these target areas has identified significant vein-hosted gold and silver mineralization spanning over two kilometres on surface with visible gold observed in multiple quartz-sulphide veins (Figure 2).
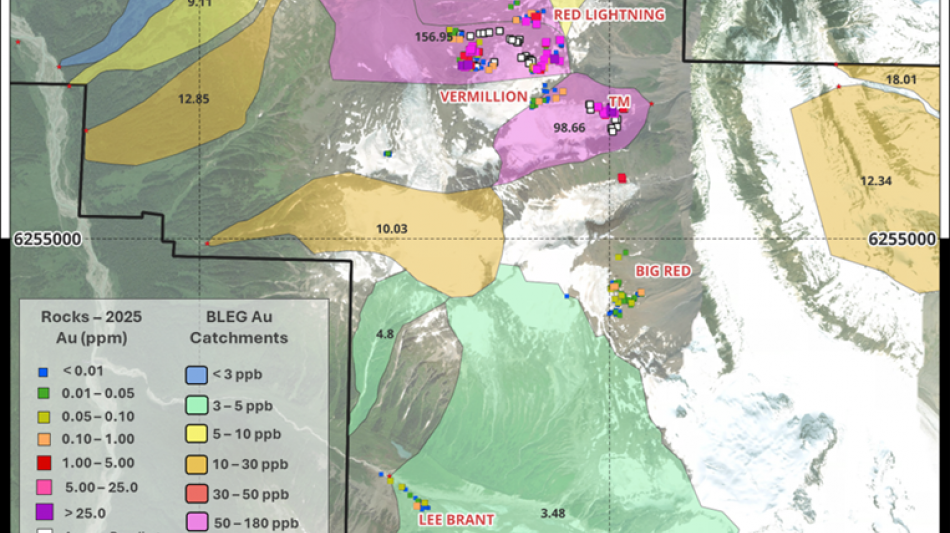
Figure 1. Gold values for 2020-2022 BLEG sampling programs at the southeast area of the Eskay Project with 2025 rock sample gold assays.
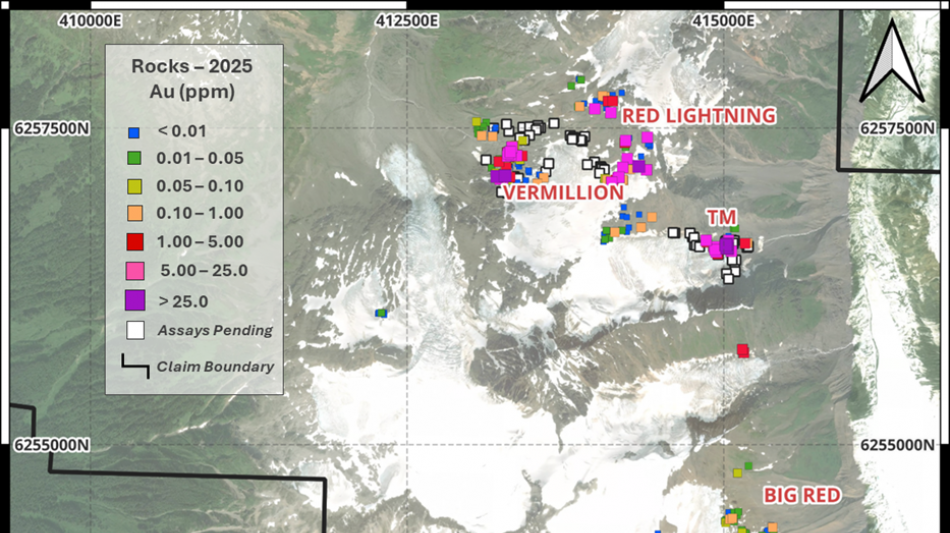
Figure 2. 2025 sample map location of target zones around Unuk Finger with gold assay results.
Results from the Vermillion, TM and Red Lightning Zones
Exploration conducted across the Vermillion, TM and Red Lightning targets has identified significant vein-hosted gold and silver mineralization that share many characteristics with reduced intrusion-related gold systems (RIRGS). Prospecting and reconnaissance mapping have discovered flat lying, sheeted and planar shear quartz vein zones spanning over 600 metres vertically and 500 by 2000 metres laterally with further areas to assess moving forward (Figure 3). Veining is spatially related to a biotite-hornblende quartz monzonite intrusion of the Lee Brant intrusive stock believed to be of Eocene age which covers a 40 sq/km area south of the vein zones.
In-situ visible gold and electrum mineralization have been identified over a 2km strike length occurring in multiple planar and sheeted quartz-carbonate veins at both the Vermillion and TM zone to the east. Veins hosting accessory pyrrhotite, chalcopyrite, bismuthinite, and rarely wolframite and gold show strong correlations with copper, bismuth and silver with anomalous tellurium. Lead and zinc (+/- silver) veins have also been sampled and may represent distal expressions of the mineralizing system. Mineralized veins are primarily hosted in metavolcanic and volcaniclastic sequences of the Lower to Middle Jurassic Hazelton Group and have also been observed in float boulders of the Lee Brant Stock quartz monzonite.
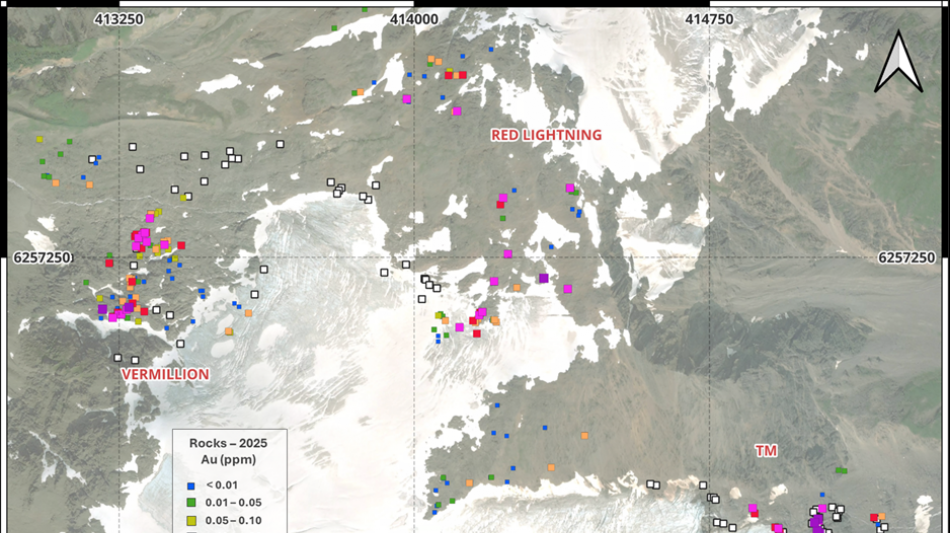
Figure 3. 2025 rock sample assays for gold from Vermillion, TM, and Red Lightning zones.
A total of 209 rock sample assays has been received from the Vermillion, TM, and Red Lightning zones to date with additional samples pending assay results.
Assay Highlights from TM Zone
7 spot rock chip samples assayed > 10 g/t Au, 11 samples assayed > 5 g/t Au, and 21 samples assayed > 1 g/t Au
Spot rock chip sample A0519908 assayed 246 g/t Au, 22.8 g/t Ag, and 0.25% Cu
Spot rock chip sample A0513144 assayed 150 g/t Au, 76 g/t Ag, and 1.57% Cu
Spot rock chip sample A0519907 assayed 86.2 g/t Au, 180 g/t Ag, and 2.63% Cu
Assay Highlights from Vermillion and Red Lightning Zones
10 spot rock chip samples assayed > 10 g/t Au, 23 samples assayed > 5 g/t Au, and 43 samples assayed > 1 g/t Au
Spot rock chip sample A0513397 assayed 71.4 g/t Au, 15.8 g/t Ag, and 0.66% Cu
Spot rock chip sample A0514206 assayed 33.7 g/t Au, 257 g/t Ag, and 2.7% Cu
Spot rock chip sample A0514399 assayed 28.8 g/t Au, 363 g/t Ag, and 0.49% Cu
Table 1. Select assay highlights from TM zone rock samples.
Sample ID | Zone | Easting | Northing | Elevation (m) | Au (g/t) | Ag (g/t | Cu (%) |
A0519908 | TM | 415017 | 6256576 | 1403 | 247 | 22.8 | 0.25 |
A0513144 | TM | 415030 | 6256549 | 1373 | 150 | 76.0 | 1.57 |
A0519907 | TM | 415026 | 6256585 | 1390 | 86.2 | 180 | 2.64 |
A0513145 | TM | 415024 | 6256556 | 1335 | 43.1 | 29.7 | 0.66 |
A0519911 | TM | 414931 | 6256540 | 1467 | 17.1 | 20.1 | 0.91 |
A0513148 | TM | 414940 | 6256522 | 1347 | 13.8 | 81.0 | 2.26 |
A0519914 | TM | 414860 | 6256613 | 1509 | 10.2 | 19.9 | 0.69 |
A0519906 | TM | 415028 | 6256581 | 1388 | 8.28 | 9.01 | 0.27 |
A0513150 | TM | 414925 | 6256561 | 1382 | 7.24 | 4.77 | 0.19 |
A0513147 | TM | 415061 | 6256528 | 1380 | 6.28 | 58.7 | 1.31 |
A0513143 | TM | 415037 | 6256612 | 1338 | 6.26 | 25.2 | 0.37 |
A0519910 | TM | 414952 | 6256506 | 1444 | 3.72 | 34.4 | 0.85 |
A0513137 | TM | 415159 | 6255726 | 1396 | 2.76 | 100 | 4.07 |
A0513151 | TM | 414917 | 6256564 | 1386 | 1.65 | 47.9 | 1.86 |
A0519901 | TM | 415148 | 6255753 | 1484 | 1.46 | 41.7 | 2.50 |
A0519904 | TM | 415168 | 6256589 | 1294 | 1.24 | 159 | 11.3 |
Table 2. Select assay highlights from Vermillion zone rock samples.
Sample ID | Zone | Easting | Northing | Elevation (m) | Au (g/t) | Ag (g/t | Cu (%) |
A0514397 | Vermillion | 413208 | 6257118 | 1426 | 71.4 | 15.8 | 0.66 |
A0514399 | Vermillion | 413275 | 6257123 | 1463 | 28.8 | 363 | 0.49 |
A0514036 | Vermillion | 413249 | 6257104 | 1459 | 23.6 | 2.51 | 0.19 |
A0514497 | Vermillion | 413316 | 6257312 | 1315 | 19.8 | 10.8 | 0.26 |
A0514440 | Vermillion | 413299 | 6257299 | 1412 | 19.4 | 1.92 | 0.13 |
A0514398 | Vermillion | 413234 | 6257096 | 1453 | 8.30 | 14.7 | 0.15 |
A0514449 | Vermillion | 413269 | 6257117 | 1467 | 7.82 | 11.6 | 0.16 |
A0514491 | Vermillion | 413328 | 6257349 | 1377 | 7.72 | 3.75 | 0.19 |
A0514030 | Vermillion | 413365 | 6257282 | 1449 | 7.64 | 171 | 0.30 |
A0514041 | Vermillion | 413256 | 6257105 | 1459 | 6.67 | 1.41 | 0.03 |
A0514389 | Vermillion | 413320 | 6257289 | 1436 | 6.33 | 91.2 | 0.97 |
A0513110 | Vermillion | 413293 | 6257278 | 1538 | 6.09 | 4.05 | 0.10 |
A0513108 | Vermillion | 413283 | 6257188 | 1436 | 4.98 | 34.4 | 0.83 |
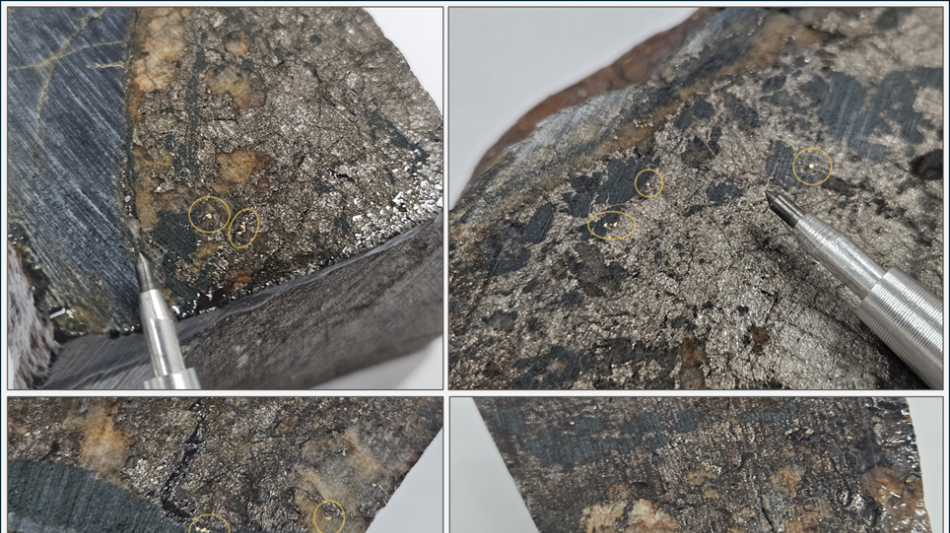
Figure 4. Visible gold from TM sample A0519908 assaying 246 g/t Au.
Preliminary Channel Sample Assay Results
A total of 41.77m of channel sampling has been completed to date at the Vermillion and TM zones and initial assays have been received for samples at Vermillion.
A total of 25.25m across 4 channel series were completed at Vermillion testing different vein generations for gold mineralization potential (Table 4). Channel V1 was sampled over veins with known gold grades from 2024 samples where visible gold was observed. Channel V1 assayed 21.8 g/t Au, 19.9 g/t Ag, and 0.69% Cu over 1.00m. Channel V2 to V4 were planned over vein zones with unknown gold grades identified in 2025. Channel V2 assayed 1.02 g/t Au over 7.25m, channel V3 assayed 0.07 g/t Au over 7.00m and channel V4 assayed 0.10 g/t Au over 10.0m.
While preliminary channel samples returned modest gold grades, most of the sampling was conducted with initial rock assays outstanding. Additional channel sampling is ongoing at the TM Zone testing across multiple vein sets where assay results have been returned.
Table 4. Vermillion Channel Sample Assay Results
Sample ID | Channel Series | From | To | Width (m) | Au (g/t) | Ag (g/t) |
A0514151 | Channel V1 | 0.00 | 1.00 | 1.00 | 21.8 | 20.0 |
A0514152 | Channel V2 | 0.00 | 1.00 | 1.00 | 0.35 | 0.99 |
A0514153 | Channel V2 | 1.00 | 2.00 | 1.00 | 0.09 | 0.56 |
A0514154 | Channel V2 | 2.00 | 3.00 | 1.00 | 0.25 | 0.74 |
A0514155 | Channel V2 | 3.00 | 4.00 | 1.00 | 0.32 | 1.26 |
A0514156 | Channel V2 | 4.00 | 4.25 | 0.25 | 24.5 | 44.4 |
A0514157 | Channel V2 | 4.25 | 5.15 | 0.90 | 0.09 | 0.25 |
A0514158 | Channel V2 | 5.15 | 5.35 | 0.20 | 0.01 | 0.16 |
A0514159 | Channel V2 | 5.35 | 6.25 | 0.90 | 0.06 | 0.32 |
A0514160 | Channel V2 | 6.25 | 6.95 | 0.70 | 0.16 | 0.36 |
A0514161 | Channel V2 | 6.95 | 7.25 | 0.30 | 0.06 | 0.16 |
A0514162 | Channel V3 | 0.00 | 1.00 | 1.00 | 0.05 | 0.92 |
A0514163 | Channel V3 | 1.00 | 2.00 | 1.00 | 0.11 | 1.16 |
A0514164 | Channel V3 | 2.00 | 3.00 | 1.00 | 0.02 | 0.24 |
A0514165 | Channel V3 | 3.00 | 4.00 | 1.00 | 0.05 | 0.37 |
A0514166 | Channel V3 | 4.00 | 5.00 | 1.00 | 0.06 | 0.28 |
A0514167 | Channel V3 | 5.00 | 6.00 | 1.00 | 0.17 | 0.32 |
A0514168 | Channel V3 | 6.00 | 7.00 | 1.00 | 0.04 | 0.42 |
A0514169 | Channel V4 | 0.00 | 1.00 | 1.00 | 0.09 | 4.92 |
A0514170 | Channel V4 | 1.00 | 1.50 | 0.50 | 0.31 | 11.8 |
A0514171 | Channel V4 | 1.50 | 2.50 | 1.00 | 0.03 | 1.51 |
A0514172 | Channel V4 | 2.50 | 3.30 | 0.80 | 0.07 | 1.39 |
A0514173 | Channel V4 | 3.30 | 4.30 | 1.00 | 0.13 | 2.03 |
A0514174 | Channel V4 | 4.30 | 5.30 | 1.00 | 0.13 | 3.24 |
A0514175 | Channel V4 | 5.30 | 6.00 | 0.70 | 0.04 | 0.48 |
A0514176 | Channel V4 | 6.00 | 7.00 | 1.00 | 0.07 | 0.63 |
A0514177 | Channel V4 | 7.00 | 8.00 | 1.00 | 0.20 | 0.92 |
A0514178 | Channel V4 | 8.00 | 9.00 | 1.00 | 0.08 | 0.94 |
A0514179 | Channel V4 | 9.00 | 10.00 | 1.00 | 0.09 | 0.86 |
Results from the Big Red Zone
A total of 61 rock samples were collected at the Big Red Zone early in the program and all assays have now been received. While assay results returned generally low Au-Ag grades, sampling revealed elevated Cu-Mo-W grades and samples plot high values on the Mineral Deposit Research Group (MDRU) porphyry index (MPIx). A higher MPIx value indicates closer proximity to porphyry-type mineralization and utilizes normalized ratios of elements enriched in the core of a porphyry system with those typically enriched in shallow levels above the system (Figure 6).
The Big Red Zone is characterized by a large prominent gossan where metasedimentary and volcanic rocks of the Jurassic Hazelton Group are dominated by moderate to strong hornfelsing with structurally controlled zones of quartz-sericite-pyrite alteration. Volcanics are observed to host quartz-sulphide veins, generally 5-25cm wide and sometimes up to 1.5m wide, hosting pyrite-magnetite-chalcopyrite-pyrrhotite mineralization with rare occurrences of molybdenite.
Early season work in the area resulted in large portions of the target remaining under snow cover and further work is planned to assess the extents of mineralization and alteration on this newly identified potential porphyry-copper target.
Table 5. Select assay highlights from Big Red zone rock samples.
Sample ID | Zone | Easting | Northing | Elevation (m) | Cu (%) | Mo (ppm) |
A0514370 | Big Red | 415069 | 6254418 | 1611 | 0.67 | 5.30 |
A0514472 | Big Red | 415018 | 6254406 | 1635 | 0.62 | 4.10 |
A0514302 | Big Red | 415304 | 6254282 | 1527 | 0.32 | 91.7 |
A0514368 | Big Red | 415048 | 6254411 | 1623 | 0.31 | 521 |
A0514362 | Big Red | 415179 | 6254235 | 1591 | 0.03 | 1146 |
A0514368 | Big Red | 415048 | 6254411 | 1623 | 0.31 | 521 |
A0514474 | Big Red | 415008 | 6254397 | 1623 | 0.18 | 352 |
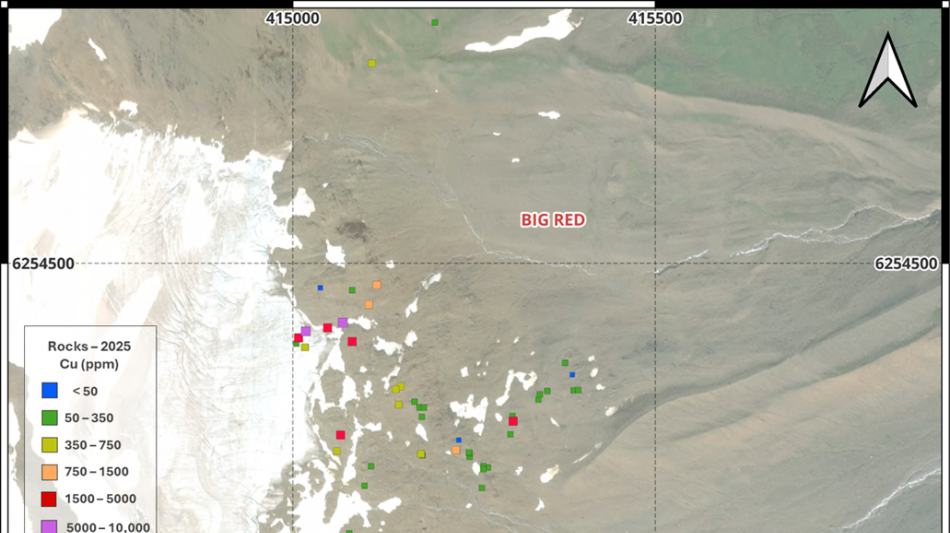
Figure 5. 2025 rock sample assays for copper from the Big Red zone.
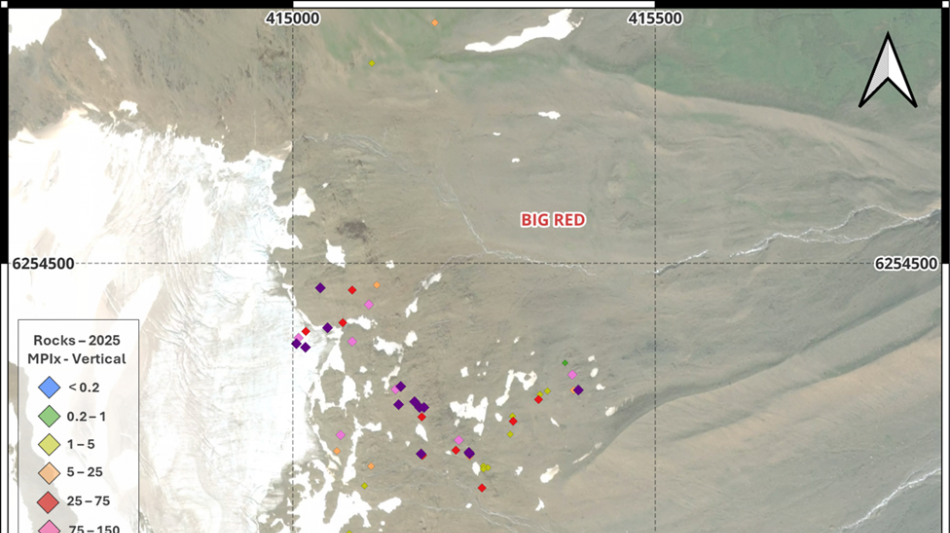
Figure 6. MPIx porphyry indicator values for Big Red.
Click here for complete rock and channel sample assay data.
QA/QC Methodology Statement
Rock chip samples were submitted to MSA Labs in Terrace, British Columbia for preparation and analysis. ALS is accredited to the ISO/IEC 17025 standard for gold assays. All analytical methods include quality control standards inserted at set frequencies. The entire sample interval is crushed and homogenized, 250 g of the homogenized sample is pulped. All samples were analyzed for gold, silver, and a suite of 48 major and trace elements. Analysis for gold is by fire assay fusion followed by Inductively Coupled Plasma Atomic Emission Spectroscopy (ICP-AES) on 30 g of pulp. Analysis for silver is by fire assay and gravimetric analysis on 30 g of pulp. All other major and trace elements are analyzed by four-acid digestion followed by ICP-MS.
Qualified Person
Dr. Quinton Hennigh, P. Geo., a Director of the Company and its technical adviser, a qualified person as defined by National Instrument 43-101, has reviewed and approved the technical contents of this news release.
About Eskay Mining Corp:
Eskay Mining Corp (TSXV:ESK) is a TSX Venture Exchange listed company, headquartered in Toronto, Ontario. Eskay is an exploration company focused on the exploration and development of precious and base metals along the Eskay rift in a highly prolific region of northwest British Columbia known as the "Golden Triangle," 70km northwest of Stewart, BC. The Company currently holds mineral tenures in this area comprised of 177 claims (52,600 hectares).
All material information on the Company may be found on its website at www.eskaymining.com and on SEDAR+ at www.sedarplus.com.
For further information, please contact:
Mac Balkam | T: 416 907 4020 |
President & Chief Executive Officer |
Neither the TSX Venture Exchange nor its Regulation Services Provider (as that term is defined in the policies of the TSX Venture Exchange) accepts responsibility for the adequacy or accuracy of this release.
Forward-Looking Statements: This Press Release contains forward-looking statements that involve risks and uncertainties, which may cause actual results to differ materially from the statements made. When used in this document, the words "may", "would", "could", "will", "intend", "plan", "anticipate", "believe", "estimate", "expect" and similar expressions are intended to identify forward-looking statements. Such statements reflect our current views with respect to future events and are subject to risks and uncertainties. Many factors could cause our actual results to differ materially from the statements made, including those factors discussed in filings made by us with the Canadian securities regulatory authorities. Should one or more of these risks and uncertainties, such as actual results of current exploration programs, the general risks associated with the mining industry, the price of gold and other metals, currency and interest rate fluctuations, increased competition and general economic and market factors, occur or should assumptions underlying the forward looking statements prove incorrect, actual results may vary materially from those described herein as intended, planned, anticipated, or expected. We do not intend and do not assume any obligation to update these forward-looking statements, except as required by law. Shareholders are cautioned not to put undue reliance on such forward-looking statements.
SOURCE: Eskay Mining Corp.
View the original press release on ACCESS Newswire
P.Johnson--RTC